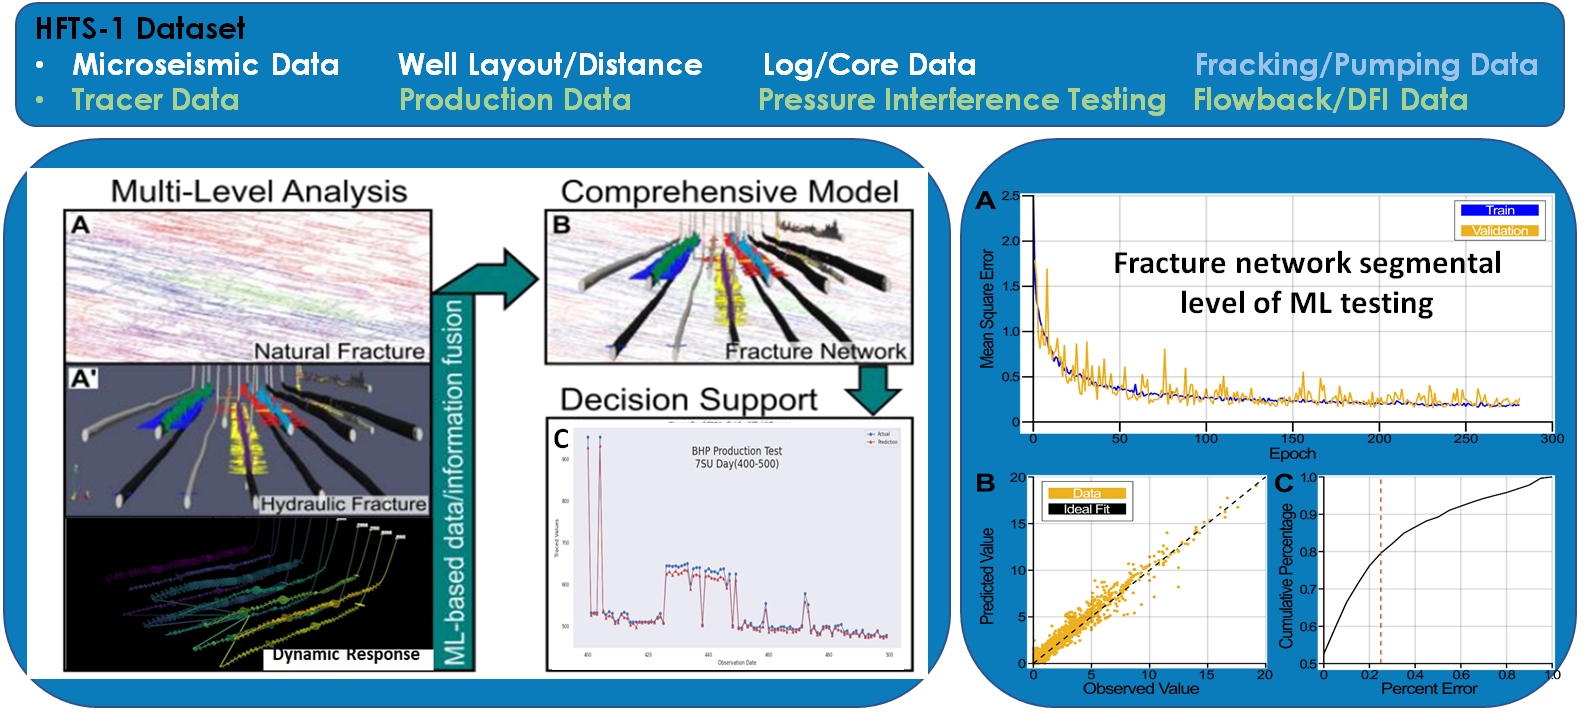
- Innovatively exploring knowledge from static data, dynamic data, and monitoring/testing records by using advanced machine learning (ML) techniques (committee machine ensemble & stacking neural networks, and semi-supervised learning) to visualize the fracture network showed significant promise for fracture and well performance estimation and forecasting in rapid fashion (5,000+ times faster with 95%+ accuracy).
- As show in Figure A on the left side, natural fracture knowledge was developed by analyzing core and well log data as well as imaging log and microseismic indications. Pumping and microseismic data along with well layout and location were used to extract insights for hydraulic fracture understanding in Figure A’. In addition, dynamic responses through testing and monitoring such as pressure testing; flowback and diagnostic fracture injection testing (DFIT), and tracer monitoring were examined for integrating a comprehensive fracture network understanding and visualization in Figure B. The fracture network was then used for pressure dropdown management for field operational decision making as shown in Figure C. The figures (A, B, C) on right-side are ML testing plots for analysis
Multi-Level of Fracture Network Visualization: HFTS-1 Use Case
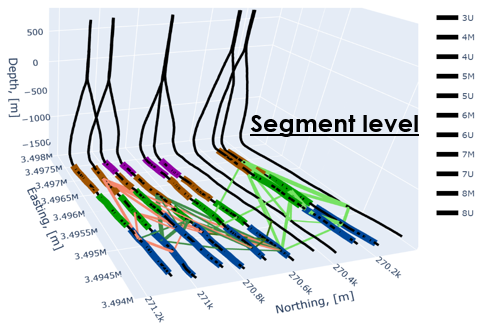
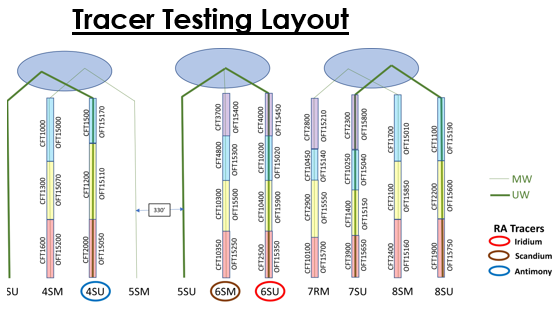
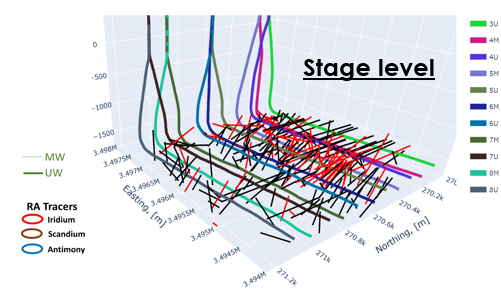
- Moreover, multi-level (well-level, segment-level, and stage-level as shown in the figures above) analysis and visualization have also been developed for producing the best value of each individual dataset based on its insights and resolution, and then researchers collectively integrated such results to the comprehensive fracture network understanding with ML techniques. The workflow were tested based on the field data from HFTS-1 and have shown great value for fracture network visualization and impact among wells.
- The multi-level analysis provided development of cross-checking insights from such datasets and benefit to uncertainty reduction as well as bias correction. The technique can be easily transferred and deployed to other fields including CO2 storage.
- The web-based interactive multi-level visualization offers a novel opportunity to zoom in/out of the fracture network insights and is user friendly for performance analysis; fracture diagnosis; and interference indications in well-level, segment-level, and stage-level for real-time decision support, ultimately reducing risk for decision support.
- The visualized fracture network can provide insights for decisions concerning completion/fracture design; frac-hit and diagnosis; re-fracking/re-stimulation; wellbore protection; infill and spacing optimization; choke/drawdown management; production performance analysis; and well shut-in and production management strategies for unconventional plays and geothermal reservoirs as well.
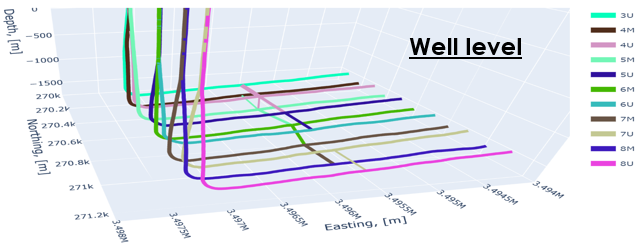
- Well level: pressure interference test, DFIT/Flowback
- Segment level: Tracer data, bumping data, well trajectory/distance
- Stage level: Bumping data, microseimic data, log/core data
